

Boosting Chip Sales: Unveiling the Game-Changing Impact of Trial Layouts in Stores with Data-Driven Analysis


Table of contents
As part of Quantium’s retail analytics team, I was tasked with helping our client examine the performance in trial vs control stores
Task – Examination of the performance in trial vs control stores
Client - The Category Manager for Chips
Objective - To test the impact of the new trial layouts with a data-driven recommendation as to whether or not the trial layout should be rolled out to all their stores.
Tools – R
Deliverables
Define metrics for the control store selection
Assess the trial store
Collate findings and provide a recommendation.
Data Analysis
The dataset that was exported from the first task assigned by the client will be used for this analysis and it was imported and saved into a data table called data, along with all the necessary libraries to help get the analysis started while also setting the theme for the plots so it won’t be a repeated step during the analysis.

Selecting control stores
The client has selected store numbers 77, 86 and 88 as trial stores and wants control stores to be established stores that are operational for the entire observation period.
The trial stores were matched to the control stores that are similar to the trial store before the trial period of Feb 2019 in terms of :
• Monthly overall sales revenue
• Monthly number of customers
• Monthly number of transactions per customer
The first step is to create the metrics of interest and filter to stores that are present throughout the pre-trial period. A new month ID in the format of yyyymm was created along with some metrics by performing some basic calculations:
totSales = total sales
nCustomers = count number of distinct customers
nTxnPerCust = number of transactions per customer
nChipsPerTxn = number of chips per transaction
avgPricePerUnit = average price per unit


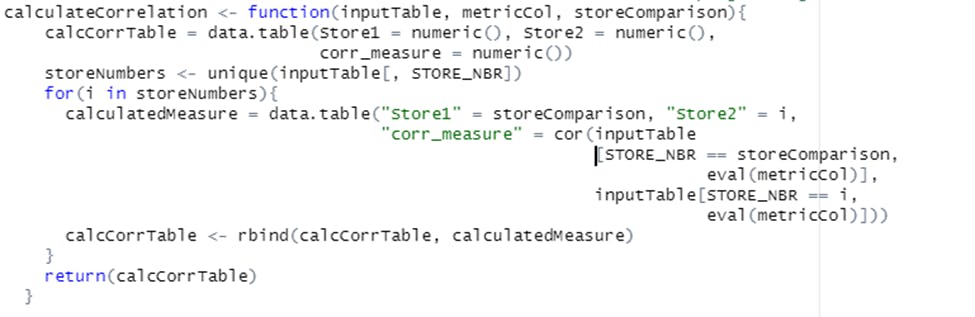
Now a way to rank how similar each potential control store is to the trial store needs to be figured out and this was done by calculating how correlated the performance of each store is to the trial store. A function was created for this so it won’t be a repeated step for each trial store and control store pair.
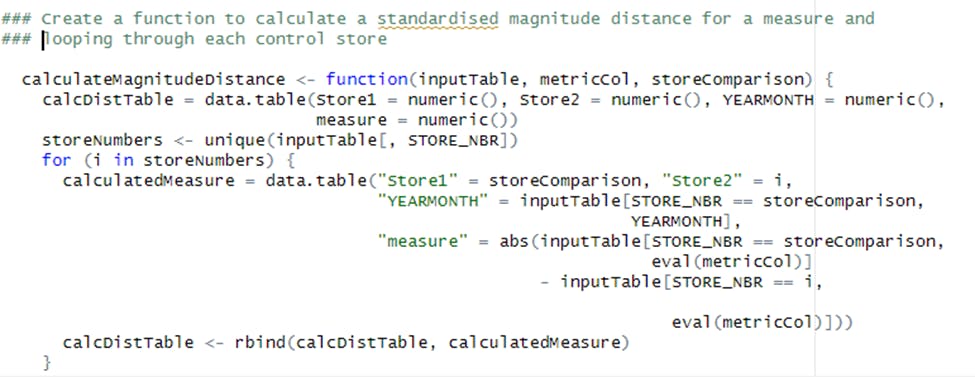
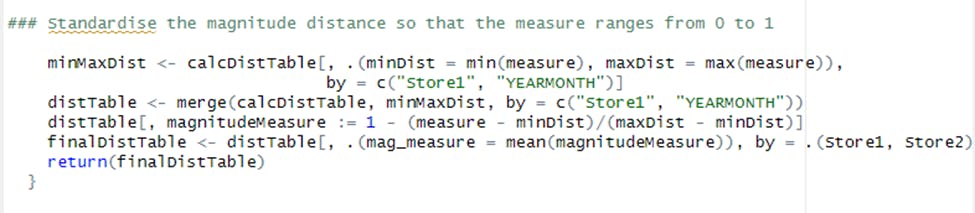
Apart from correlation, a standardized metric based on the absolute difference between the trial store’s performance and each control store’s performance was calculated as well and a function for it was written.
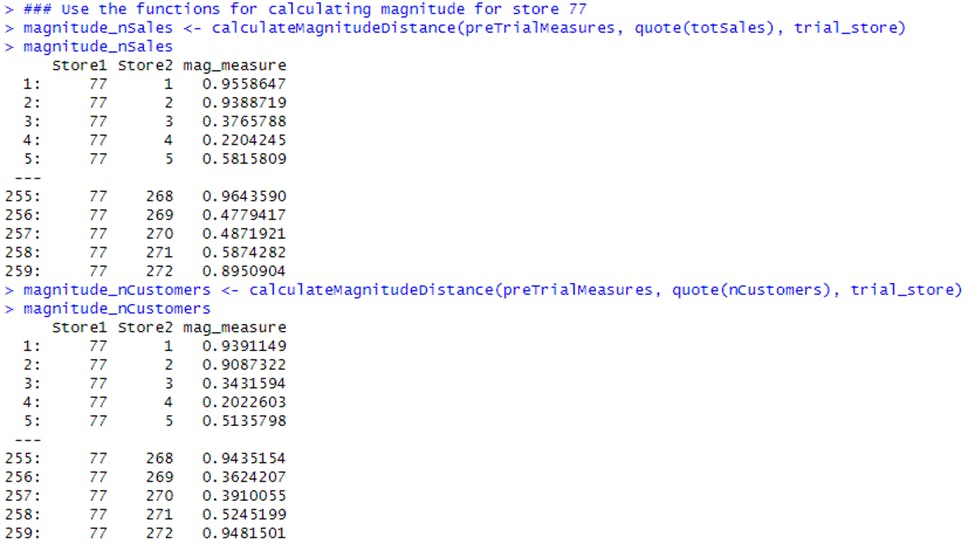
Next, the functions were used to find the control stores. The control stores were selected based on how similar monthly total sales in dollar amounts and the monthly number of customers are to the trial stores. So the functions were used to get four scores, two for each of total sales and total customers.
Trial Store 77

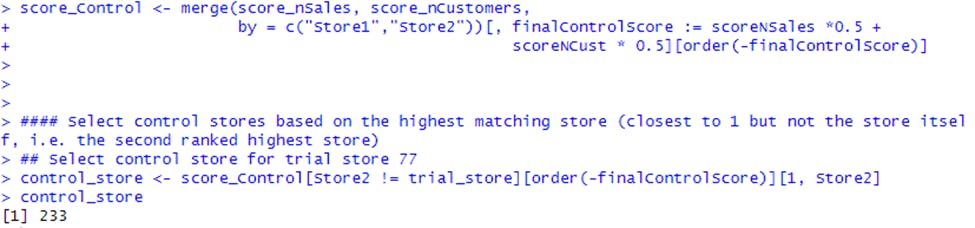
All the scores calculated were combined using the function to create a composite score to rank on. An average of the correlation and magnitude scores for each driver was taken.
Note that if it’s considered more important for the trend of the drivers to be similar, the weight of the correlation score (a simple average gives a weight of 0.5 to the corr_weight) can be increased or if it’s considered that the absolute size of the drivers to be more important, the weight of the correlation score can be lowered.

Once the score for each of the total number of sales and number of customers were gotten, they were combined using a simple average and the store with the highest score is then selected as the control store since it is most similar to the trial store which happens to be Store 233.
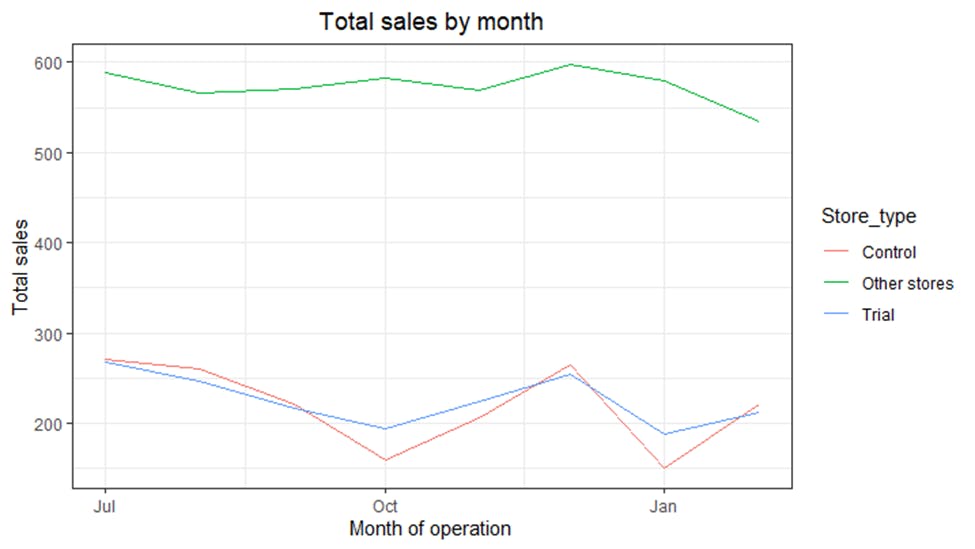
Since the control store has been located, checking visually if the drivers are indeed similar in the period before the trial was the next line of action and the total sales was looked at first.
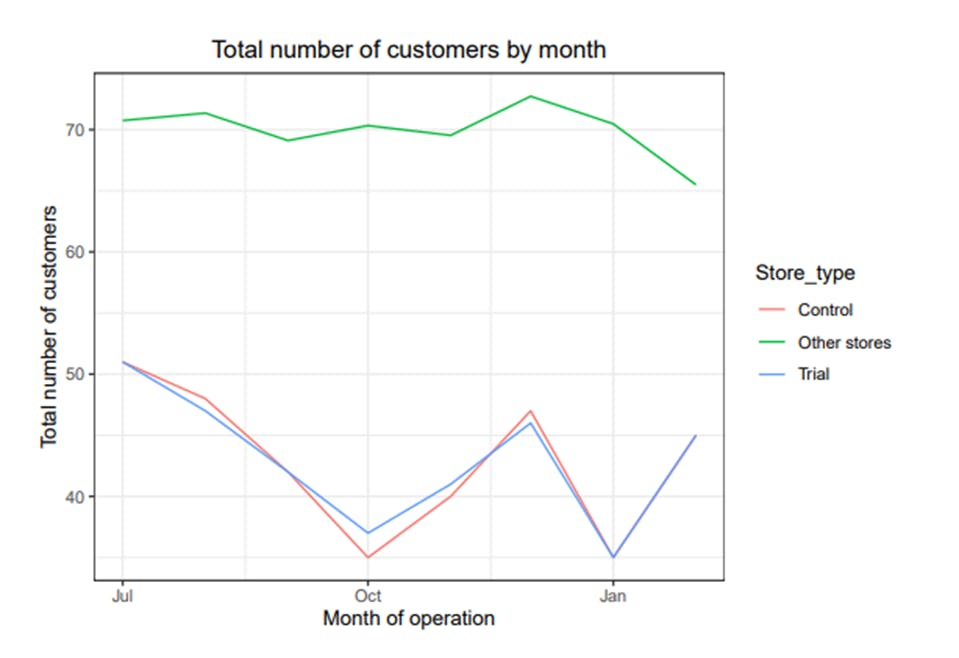
Next was the number of customers.
Assessment of trial
The trial period was between the start of March 2019 to June 2019. To see if there has been an uplift in overall chip sales, the control store’s sales were scaled to a level similar to control for any differences between the two stores outside of the trial period.

With more comparable sales figures for the control store now gotten, the percentage difference between the scaled control sales and the trial store’s sales during the trial period was then calculated.
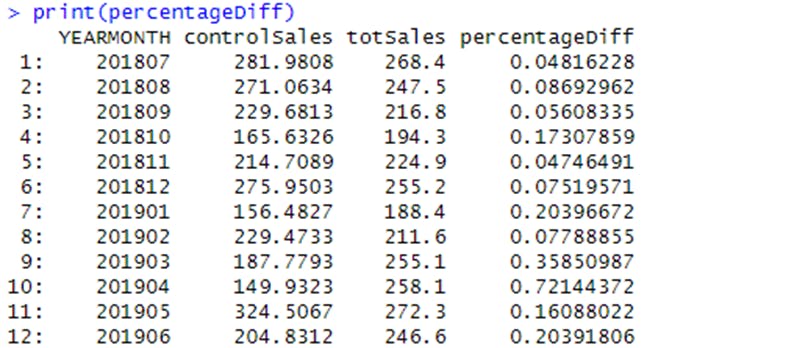
Checking to see if the difference is significant.

It was observed that the t-value is much larger than the 95th percentile value of the t-distribution for March and April - i.e. the increase in sales in the trial store in March and April is statistically greater than in the control store.
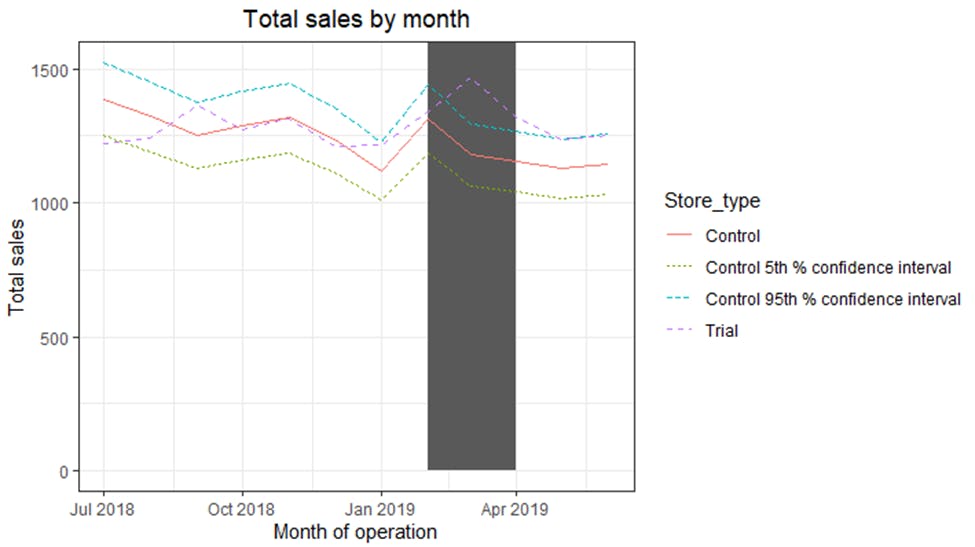
To visualize all of these, the sales of the control store, the sales of the trial stores and the 95th percentile value of sales of the control store were plotted.
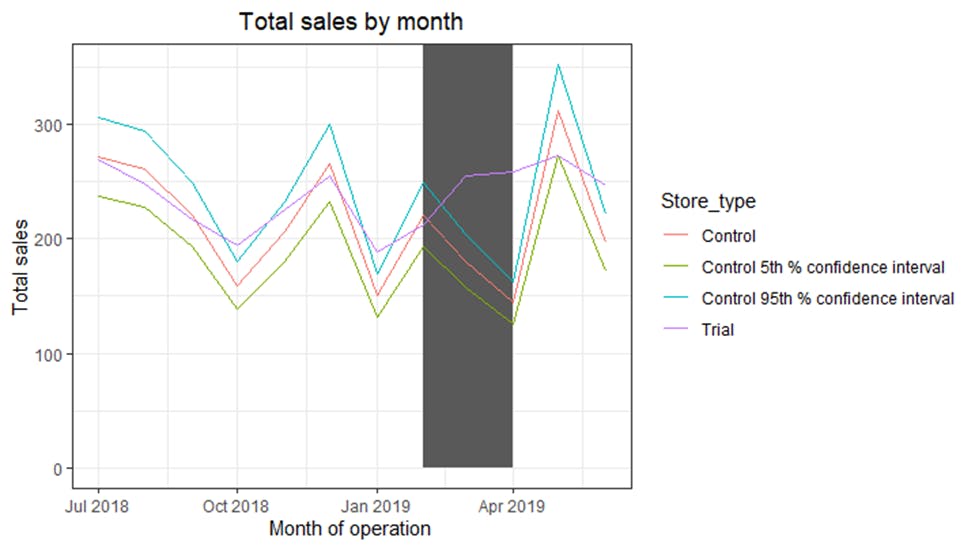
The results show that the trial in store 77 is significantly different from its control store in the trial period as the trial store performance lies outside the 5% to 95% confidence interval of the control store in two of the three trial months. The number of customers was assessed as well.

Visualizing the difference
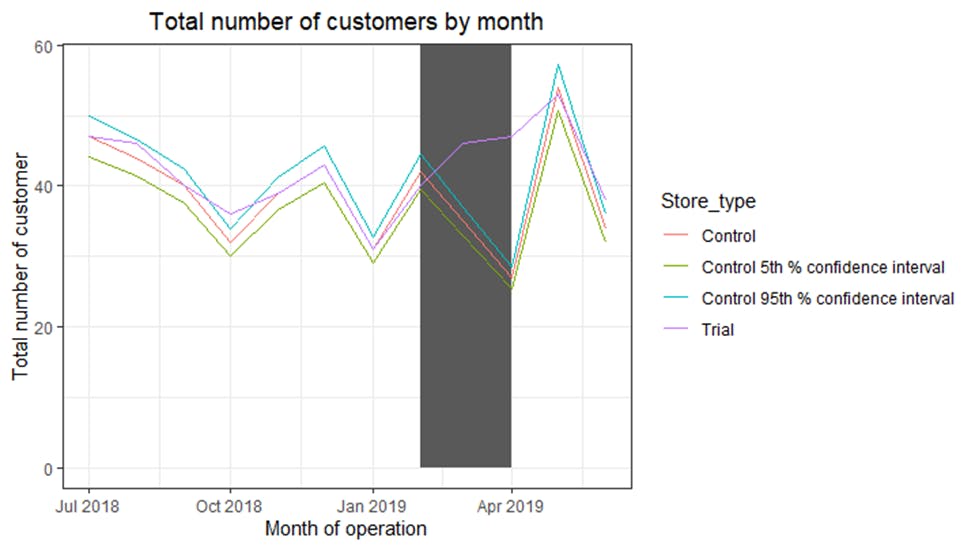
The results also show a significant difference to its control store in the trial period as the trial store performance lies outside the 5% to 95% confidence interval of the control store in two of the three trial months.
The findings were then repeated for the control store and assessed the impact of the trial for each of the other two trial stores.
Trial store 86
The above steps taken to find the control store were also used for Store 86 and the control store happens to be Store 155. The drivers were visually checked to see if they are indeed similar in the period before the trial. The total sales were looked at first before going to the number of customers.
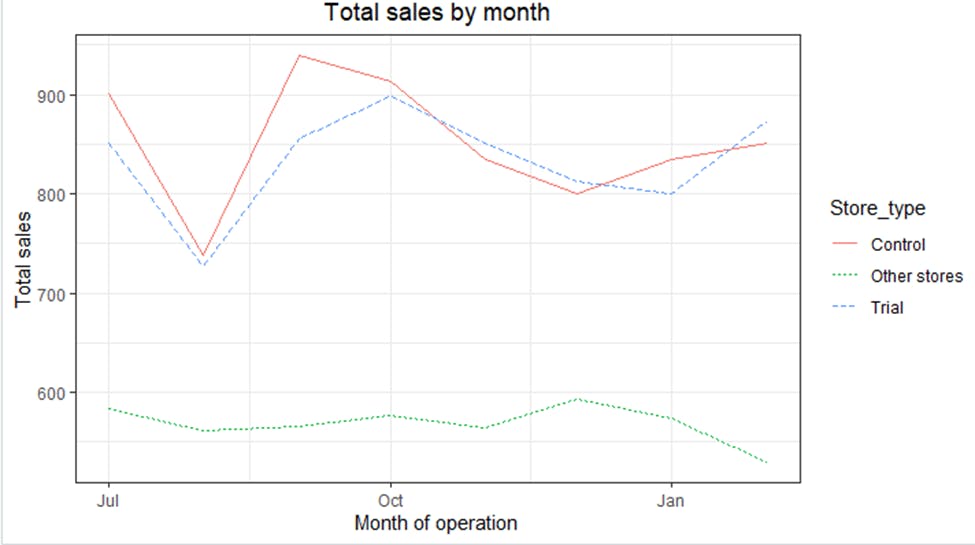
The sales are trending in a similar way which is great.

The trend in number of customers is also similar. Next is to assess the impact of the trial on sales.

The results show that the trial in store 86 is not significantly different from its control store in the trial period as the trial store performance lies inside the 5% to 95% confidence interval of the control store in two of the three trial months. Accessing the impact of the number of customers as well.

It looks like the number of customers is significantly higher in all of the three months. This seems to suggest that the trial had a significant impact on increasing the number of customers in trial store 86 but the sales were not significantly higher.
Note: A special deal in the trial store 86 could have resulted in lower prices, impacting the results and this has to be confirmed by the Category Manager.
Trial store 88
A repeat of the steps performed above was used for store 88 to find the control store which happens to be store 237. The drivers were visually checked to see if they are indeed similar in the period before the trial. The total sales were looked at first before going to the number of customers.
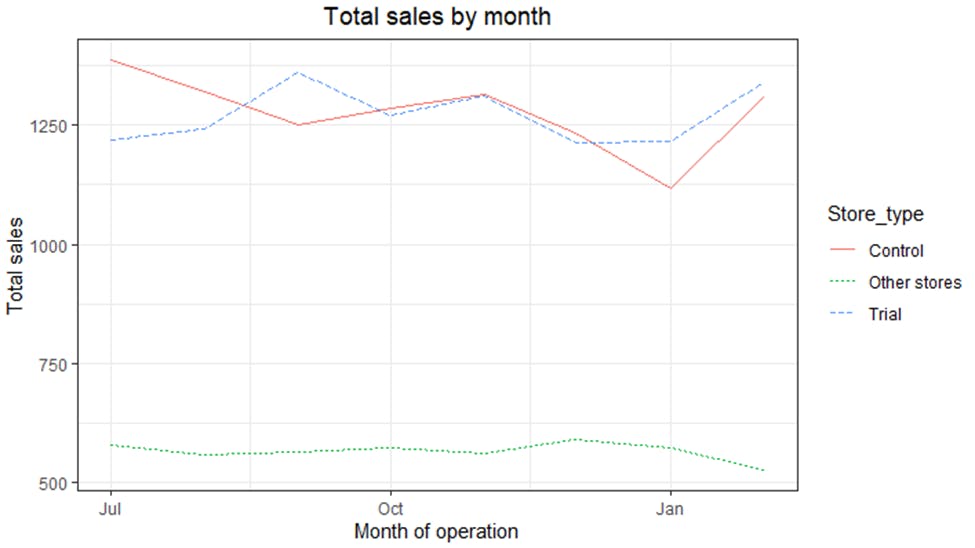
The trial and control stores have similar total sales which is a good sign. Next is to do the same for the number of customers.
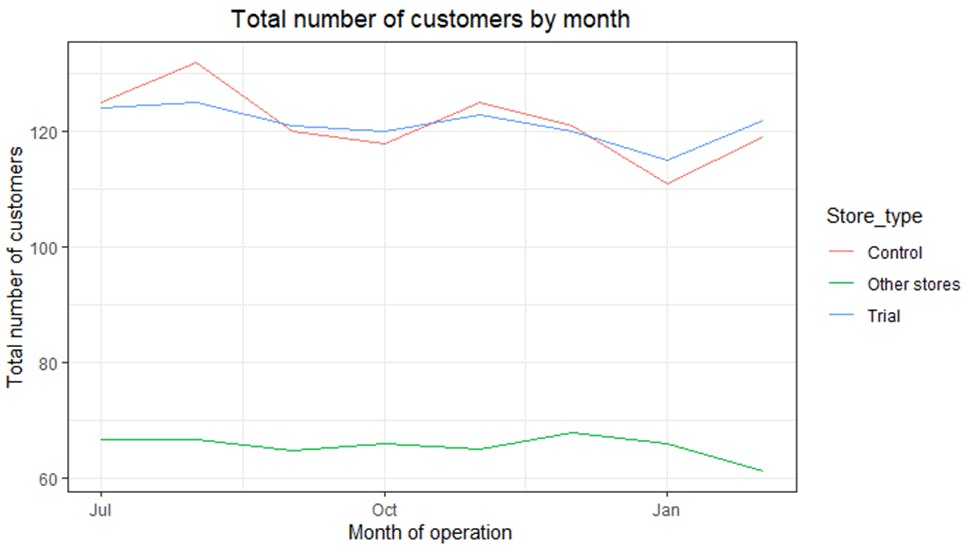
The total number of customers for the control and trial stores is also similar. Next is to assess the impact of the trial on sales.
The results show that the trial in store 88 is significantly different from its control store in the trial period as the trial store performance lies outside of the 5% to 95% confidence interval of the control store in two of the three trial months. Having a look at assessing this for the number of customers as well.

The total number of customers in the trial period for the trial store is significantly higher than the control store for two out of three months, which indicates a positive trial effect.
Recommendation
Based on the data-driven analysis, it is recommended to implement the trial layout in all stores.
The results for trial stores 77 and 88 during the trial period show a significant difference in at least two of the three trial months but this is not the case for trial store 86.
Store 77 and store 88 showed a significant increase in sales during the trial period compared to their respective control stores.
Store 86 experienced a significant increase in the number of customers during the trial period, but no significant difference in sales compared to its control store.
Conclusion
A check with the client about if the implementation of the trial store 86 was different.
Overall, the trial layouts have shown a positive impact on sales, particularly in stores 77 and 88.