


When the customer comes first, the customer will last
A Customer Retention Analysis - PhoneNow


"The more you engage with customers the clearer things become and the easier it is to determine what you should be doing." - John Russell
On my journey to becoming a data analyst after months of taking multiple courses and training, I learned businesses and companies are not after what courses you have taken or what certification you have instead they're after "what can you do for us?" " What value can you bring to the team or business?".
So to answer those questions, I decided to go on a journey of working on different projects that will help me showcase to recruiters and employers what I can do for them. On that journey, I came across the virtual internship organized by PwC Switzerland and I signed up to be a part of it.
Task 2 of the internship, I was tasked with analyzing a customer retention data to help the retention manager understand the following questions:
- Why customers are churning.
- When customers are more likely to leave.
- Which customers are likely to churn
- How churn affects your bottom line.
- How to improve your retention strategies.
To understand this analysis, you need to first understand what retention analysis is.
What is retention analysis?
Retention analysis (or survival analysis) is the process of analyzing user metrics to understand how and why customers churn. Retention analysis is key to gaining insights on how to maintain a profitable customer base by improving retention and new user acquisition rates.
Data Preparation & Cleaning
One of the questions you ask as a data analyst when getting started with a project is " Where is the data?" Fortunately for this project, the dataset was provided by the internship in an excel file but as we all know these data ain't always clean so it has to be cleaned to help ease the analysis.
Data Cleaning
Having a look at the dataset with excel, I find out that the dataset consists of 23 columns and 7044 rows with column names as follows:
- CustomerID
- Gender
- SeniorCitizen
- Partner
- Dependents
- Tenure and many more
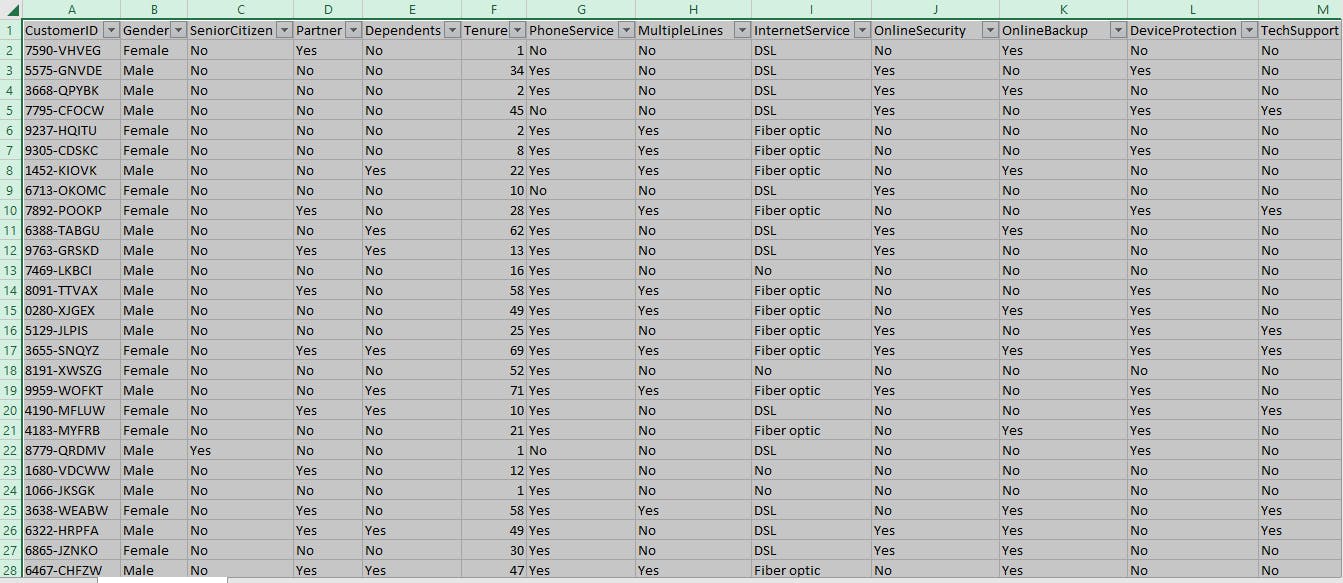
From the look of the table, some columns have 0s and 1s representing No and Yes so in order to have an accurate dataset, those columns have to be cleaned by using the Find and Replace function to replace the 0s and 1s with no and yes.
Some basic cleaning was done in excel and then moved into Microsoft Power Bi for further cleaning and some measures were created to help calculate some metrics for the dashboard.
The data type for columns that had numbers were changed to text rather than a number data type because it is not a column that will be summed together.
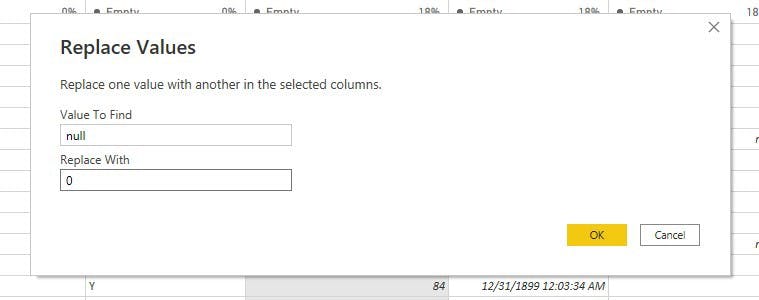
Null values were replaced with 0s
Analysis & Insights
After getting the data cleaned and moved into Power Bi proper, It's time for the analysis to be done to help answer the questions asked. The dashboard was designed following a layout drawn out on a sheet of paper to help maximize the size of the canvas.
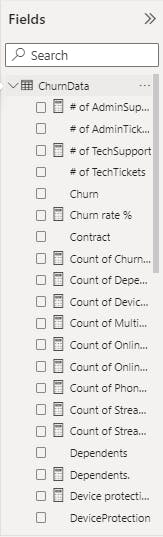
Some DAX measures were created to help calculate the Churn rate, loyalty, customers that are married with dependents, etc.
Insights
To answer the questions the retention manager asked, insights must be drawn from the dashboard but first what are these questions?
These questions are divided into 3 categories which are:
- Demographic info about customers - gender, if they have partners & dependents
- Services each customer signed up for - phone, multiple lines, internet, online backup & security, streaming, etc.
- Customer account information - how long as a customer, contract, payment method, paperless billing, etc.
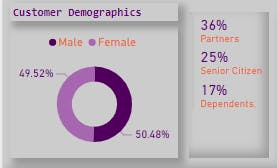
Demographic info about customers
- There is a slight tip towards the male gender with just about 51% of customers being Male while 49% of customers are Female.
- 36% of customers have partners (married) while 17% of customers have dependents.
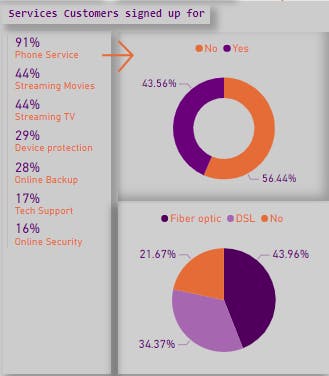
Services each customer signed up for
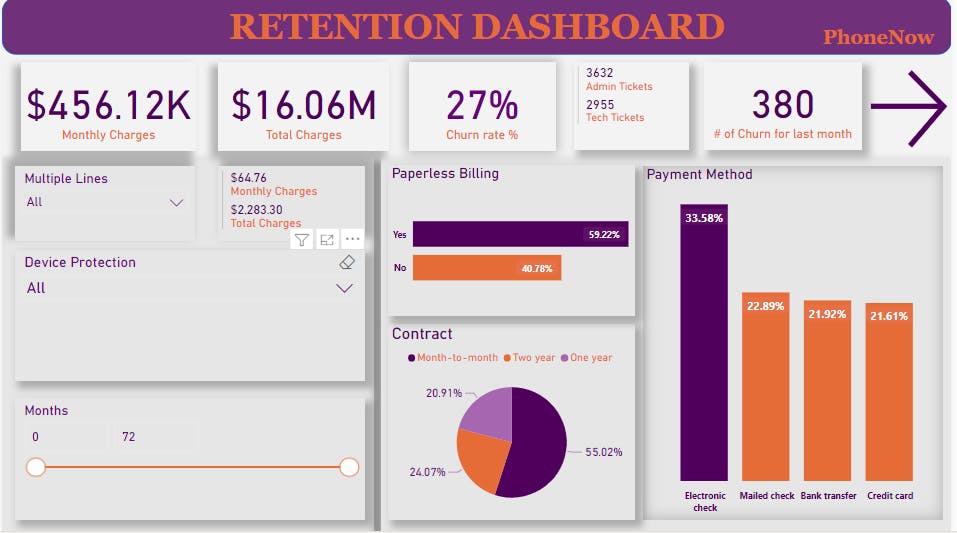
- 99% of customers signed up for the phone service with 56% of them not having multiple lines and 44% having multiple lines of phone service.
- 44% signed up for the streaming movies and Tv
- 28% signed up for online backup with that figure going down when it comes to online security with 16%
- Customers favor the Fiber Optic internet connection with a 44% ratio as compared to DSL with 34% and 22% of customers have no internet service at all.
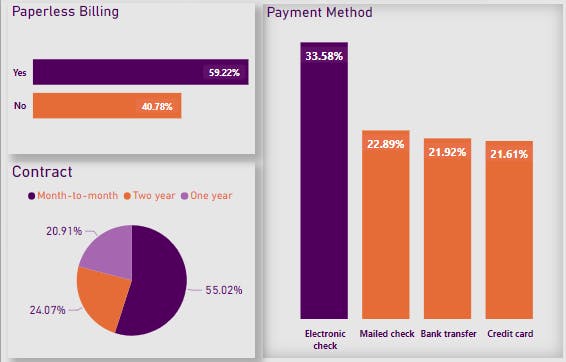
Customer account information
- Customers prefer the month-to-month contract with 55% of them opt-in for that and 24% and 21% going for the two years and one-year contract respectively.
- Customers on the month-to-month contract churn easily because once the current plan expires, they can easily not renew and just churn. Hence why they are the customers who are at risk of churning.
- With 34% of customers making payments with the electronic check, it can be seen that customers prefer this payment method more than the other options.
For more analysis on the project, kindly check out the dashboard with the link below

Link to the Dashboard
app.powerbi.com/links/onQedkwxwA?ctid=23c3d..
Your reviews and recommendations are highly welcome in the comment section.
Thanks for reading!!!