


Photo by Fauzan Saari on Unsplash
My journey to becoming a data analyst continues - Project 3
Analysis of FIFA World Cup Tournament from 1930 - 2018


Table of contents
“The more difficult the victory, the greater the happiness in winning.” - Pelé
“When people succeed, it is because of hard work. Luck has nothing to do with success.” - Diego Maradona
Here I am again folks with another project on my journey to becoming a data analyst and we're week 3 into the Side Hustle Bootcamp. For this week, I am sure you can take a guess what the project is all about - Yeah, you guessed right. It's a FIFA World Cup analysis from the year 1930 up until 2018.
As a football sucker and enthusiast, I was extremely happy when I found out we are to work on a football dataset for the week's project and unlike the previous weeks where the dataset was quite difficult to find, trust me I got datasets for this project in less than an hour because I really knew what I was looking for.
Got to say, for some of my team members who don't really know much about football, it was quite the out-of-the-comfort-zone project for them, but as usual, everyone was ready to get the project done and play their part according to their role in the team.
A humble start to the struggle
You know what they say that nothing comes easy and if it does come easy, it comes with a price. well, no one reminded us about that and we were going to find out the hard way.
Like I said that finding the dataset needed was quite easy and everyone on the team was happy because we didn't have to go searching the web for days just to get the dataset (even the organizers were surprised as to how fast we got the datasets). Here comes the struggle and heartbreak.
It started with the work we were doing in excel because we were working with a very large dataset in different excel sheets so we needed to do a lot of cleaning, finding and replacing values, and correcting the different data types, especially the date column which was literally the biggest problem we encounter as some cells were having the date format as "DD-MM-YYYY" and some as "MM-DD-YY" and also as "D-MMM-YY.
All of these cleaning and changes were done and all the tables were merged together to get one master table for our analysis in Power Bi.
Just when we thought we are winning again, we conceded a goal that sent us back to the losing position as 2 members of the team fell sick within the space of 2 days and the workload shifted to those available just so we can get the project done. But having the Real Madrid mindset that it's not over until the final whistle is blown, we got moving to work with what we have and who is available.
Analysis
To win the match, we needed to score a goal back as fast as possible as time is fast running out and we did. But we didn't just score a goal, we scored 2 to win the match.
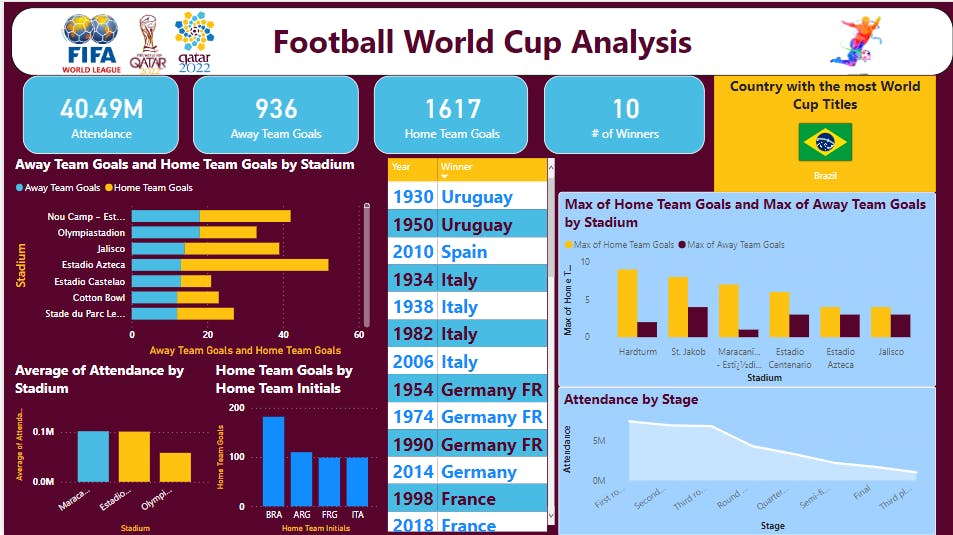
From our analysis, we found the following:
- Teams assigned as the home team have scored more goals than teams assigned as the away team over the years.
- A total of 40.5 million people have watched the world cup over the years.
- A total of 10 teams have world the world cup since the tournament started back in 1930 with Brazil winning the highest with 5 titles and Italy closely behind Brazil with 4 titles.
- Attendance decreased as the tournament progressed with the first round having the highest turnout and the third place having the lowest turnout of fans.
Click the link below to have a look at the dashboard
Link to Dashboard
app.powerbi.com/links/neHuvl0p4i?ctid=23c3d..
Hope you enjoyed reading and have fun watching this year's world cup tournament.
Cheers!!!