


Baby Steps to Becoming A Data Analyst - Project 1
Francis Supermart Sales Analysis


“There is nobody as brave as a baby taking his/her first non-stop 5 steps alone from Mummy's hand to daddy's hand...... trust me on that” ― Sameh Elsayed.
A few months back (8 to be precise), I took a baby step without an idea of what I'm getting myself into when I decided to take the Google Data Analytics Certification Course. 5 months later, I completed the certification and still didn't feel like I was there yet so I asked myself the question I have pushed aside for 5 months: Do you even know what you're doing? and is this the right path for your future?
Well, I got my answer when my path crossed a company or institute that trains individuals to become a professional in different fields, and lucky for me, they offer Data Analytics as an internship. The internship spanned 6 weeks and I got to learn and have a first-hand experience of what it feels like to be a Data Analyst in Nigeria.
At the end of the program, I decided to move forward with the Bootcamp offered by the institute called SIDE HUSTLE. Fast forward 3 weeks into the Bootcamp and managing a team of 10 individuals with the same goal of becoming a Data Analyst, and here is my first article about the first project I had to do on my journey to becoming a Data Analyst.
THE PROJECT
I and my team have finally settled in and as we wait anxiously for our task for the week, it finally arrived. The task was to choose a product in Nigeria or used by Nigerians and work on the product's Sales Insight using Microsoft Excel and Power BI after scraping, cleaning, and Visualizing the data.
PROCESS
The process began with the search for the data which proved to be very challenging, but eventually, we laid our hands on sales data from Francis Supermart in Lagos, Nigeria. The data set has a total of 4990 rows and 13 columns. We sought to provide insights that would help the CEO of Francis Supermart better understand the financial status of his various outlets across some cities as he has plans for expansion to more cities in the country.
We decided to focus our Excel analysis on determining the level of sales according to the Fat Content of different products and location factors and the impact of those factors on sales generally. Taking the well-known fact that Bread is widely consumed in Nigeria, we decided to narrow down our analysis on Microsoft Power BI to focus on Bread as the only product type to be considered.
Excel Analysis and Insights
The data was scraped from GitHub and then passed through the lens of the Data Cleaning process to help find and remove duplicates, sort out missing values, remove unnecessary columns, etc, just to make the dataset accurate enough for the insights we need to be drawn. We then proceeded to create an Excel dashboard to help visualize and uncomplicate the whole data for easy understanding by the stakeholders.
Insights
From the analysis performed, the following insights were drawn which will be taken into consideration when making our recommendation to Mr. Francis.
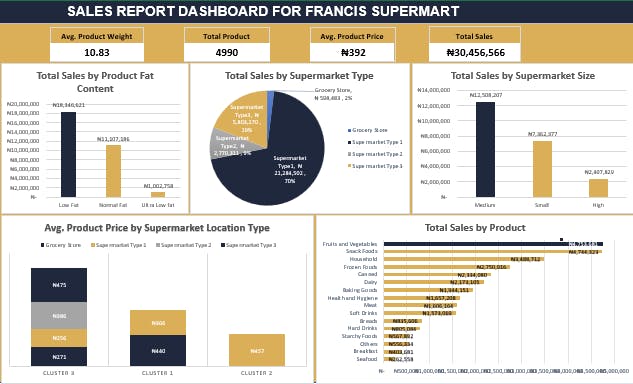
- Total Sales were 30.4 million Naira.
- A total of 4990 products were sold at an average price of 392 Naira.
- There was a significant difference in the Total Sales between low-fat products and normal fat products with a difference of 7.2 million Naira and a 10.1 million Naira difference between normal fat and ultra-fat products.
- Supermarket type 1 amassed a total of 70% of the total sales with a total of 21.2 million Naira while supermarket type 3 amassed a total of 19% at 5.8 million Naira with supermarket type 2 and grocery store having a combined 11% at a total of 3.3 million Naira in sales.
- Medium-sized supermarkets had a total of 12.5 Million Naira in sales as compared to that of small-sized supermarkets with a difference of 5.2 million Naira in sales and a further 4.9 million Naira difference between small size supermarkets and high size supermarkets.
- The difference in Sales between the top 2 products which are fruits & vegetables and Snack foods was 9,358 Naira. The top 5 products amassed a total of 18 million Naira.
Power Bi Analysis and Insights
The dataset was loaded onto Power Bi and into Power Query for further transformation before finally loading it into Power Bi proper, the necessary adjustments were made like creating a calculated column and measures to make our visualization easy before finally loading it on Power BI Desktop. The following insights were drawn from the analysis of bread as the only product focused on Power BI.
Insights From Power Bi
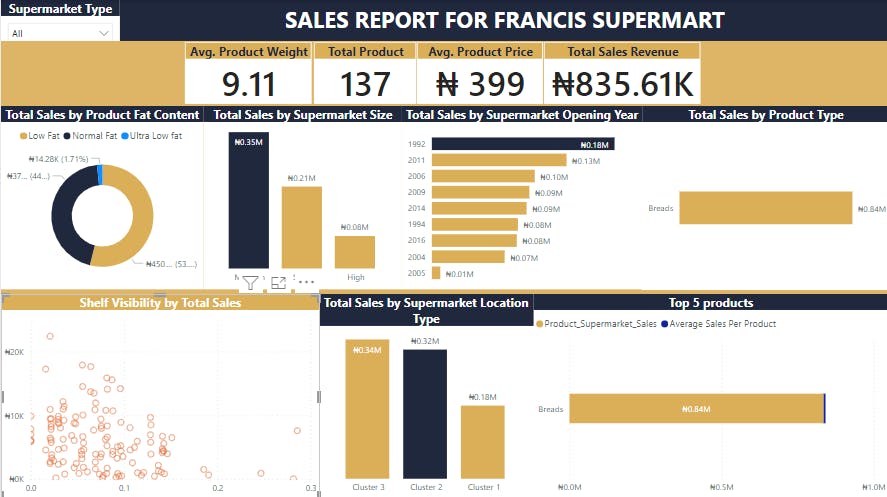
- The total sales revenue was 835.61K Naira while the average product price is approximately 400 Naira.
- The medium supermarket size has the highest number of sales with 0.35m as compared to high and small sizes.
- Low-fat content products had the highest number of sales with 53% of the total sales.
- The product shelf visibility impacted sales positively, i.e. the higher the visibility the higher the sales.
- The lower the weight of the product the higher the visibility and also the higher the sales.
- The outlet location type of clusters 2 and 3 did not have an effect on the sales since there is no significant difference between the sales of the Two outlets.
- For medium-sized outlets, sales in cluster 3 were higher than sales in cluster 1.
- For small-sized outlets, there was an insignificant difference of 50,000 Naira in sales of clusters 1 and 2 with an average product price of 420 Naira.
- After comparing the total sales of clusters 2 and 3, the difference in sales was approximately 25,000 Naira with cluster 3 having the highest number of products sold.
RECOMMENDATION
Using the Excel Insights
Mr. Francis should consider the following recommendation
- Supermarket type 1 should be the focus of the expansion as it amassed 70% of total sales.
- Medium-sized supermarkets should also be considered as a factor when expanding.
- The financial welfare of the Supermarket is good with a general revenue of about 30 million naira.
Using the Power BI Insights
- Bread as a product in the Medium-sized stores in the Cluster 3 location is doing very well. therefore, it is recommended that the supply of bread is increased.
- Low-fat content products (bread) should be increased as they had the highest number of sales amongst all content types.
- It's recommended that the shelf visibility should be heavily considered as it also impacts the sales
If you'll like to know more about the analysis and dataset, click on the link below. drive.google.com/drive/folders/1B1IP81NcJUc..
Thanks for reading!!!
Till next time, bye and have fun!